October 14, 2025

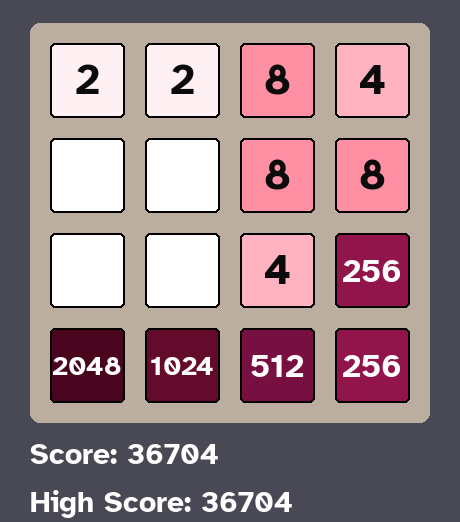
For Breast Cancer Awareness Month 2025 , I created a pink-coded 2048 game clone.
There were two important objectives I had
in mind for it. First, no ads, and second, accessibility to low-vision users.
Therefore, I optimised accessibility
using WCAG AAA colour standards for large text and a legible font.
Although the OpenDyslexic3 font was my first choice,
beta users had some problems with it, so I switched to the Atkinson Hyperlegible font.
The game is available for download (Windows-only).
Tools used: Python, Pygame library, PyInstaller
A joint project with my team members from Team Kapwepwe, Cohort 8 AI Saturdays, to analyse customer reviews of restaurants
and hotels for their sentiments. This would empower Nigerians in making better informed choices and help restaurants and hotels improve their services by leveraging guest feedback.
Tools used: Python, vaderSentimentAnalysis package, Streamlit, Microsoft Excel
A summary of my take-home assignments and exercises done from my Data Science and ML classes
at AI Saturdays Lagos.
A compilation of all SQL and Python projects I have completed on DataCamp.

The data, found here
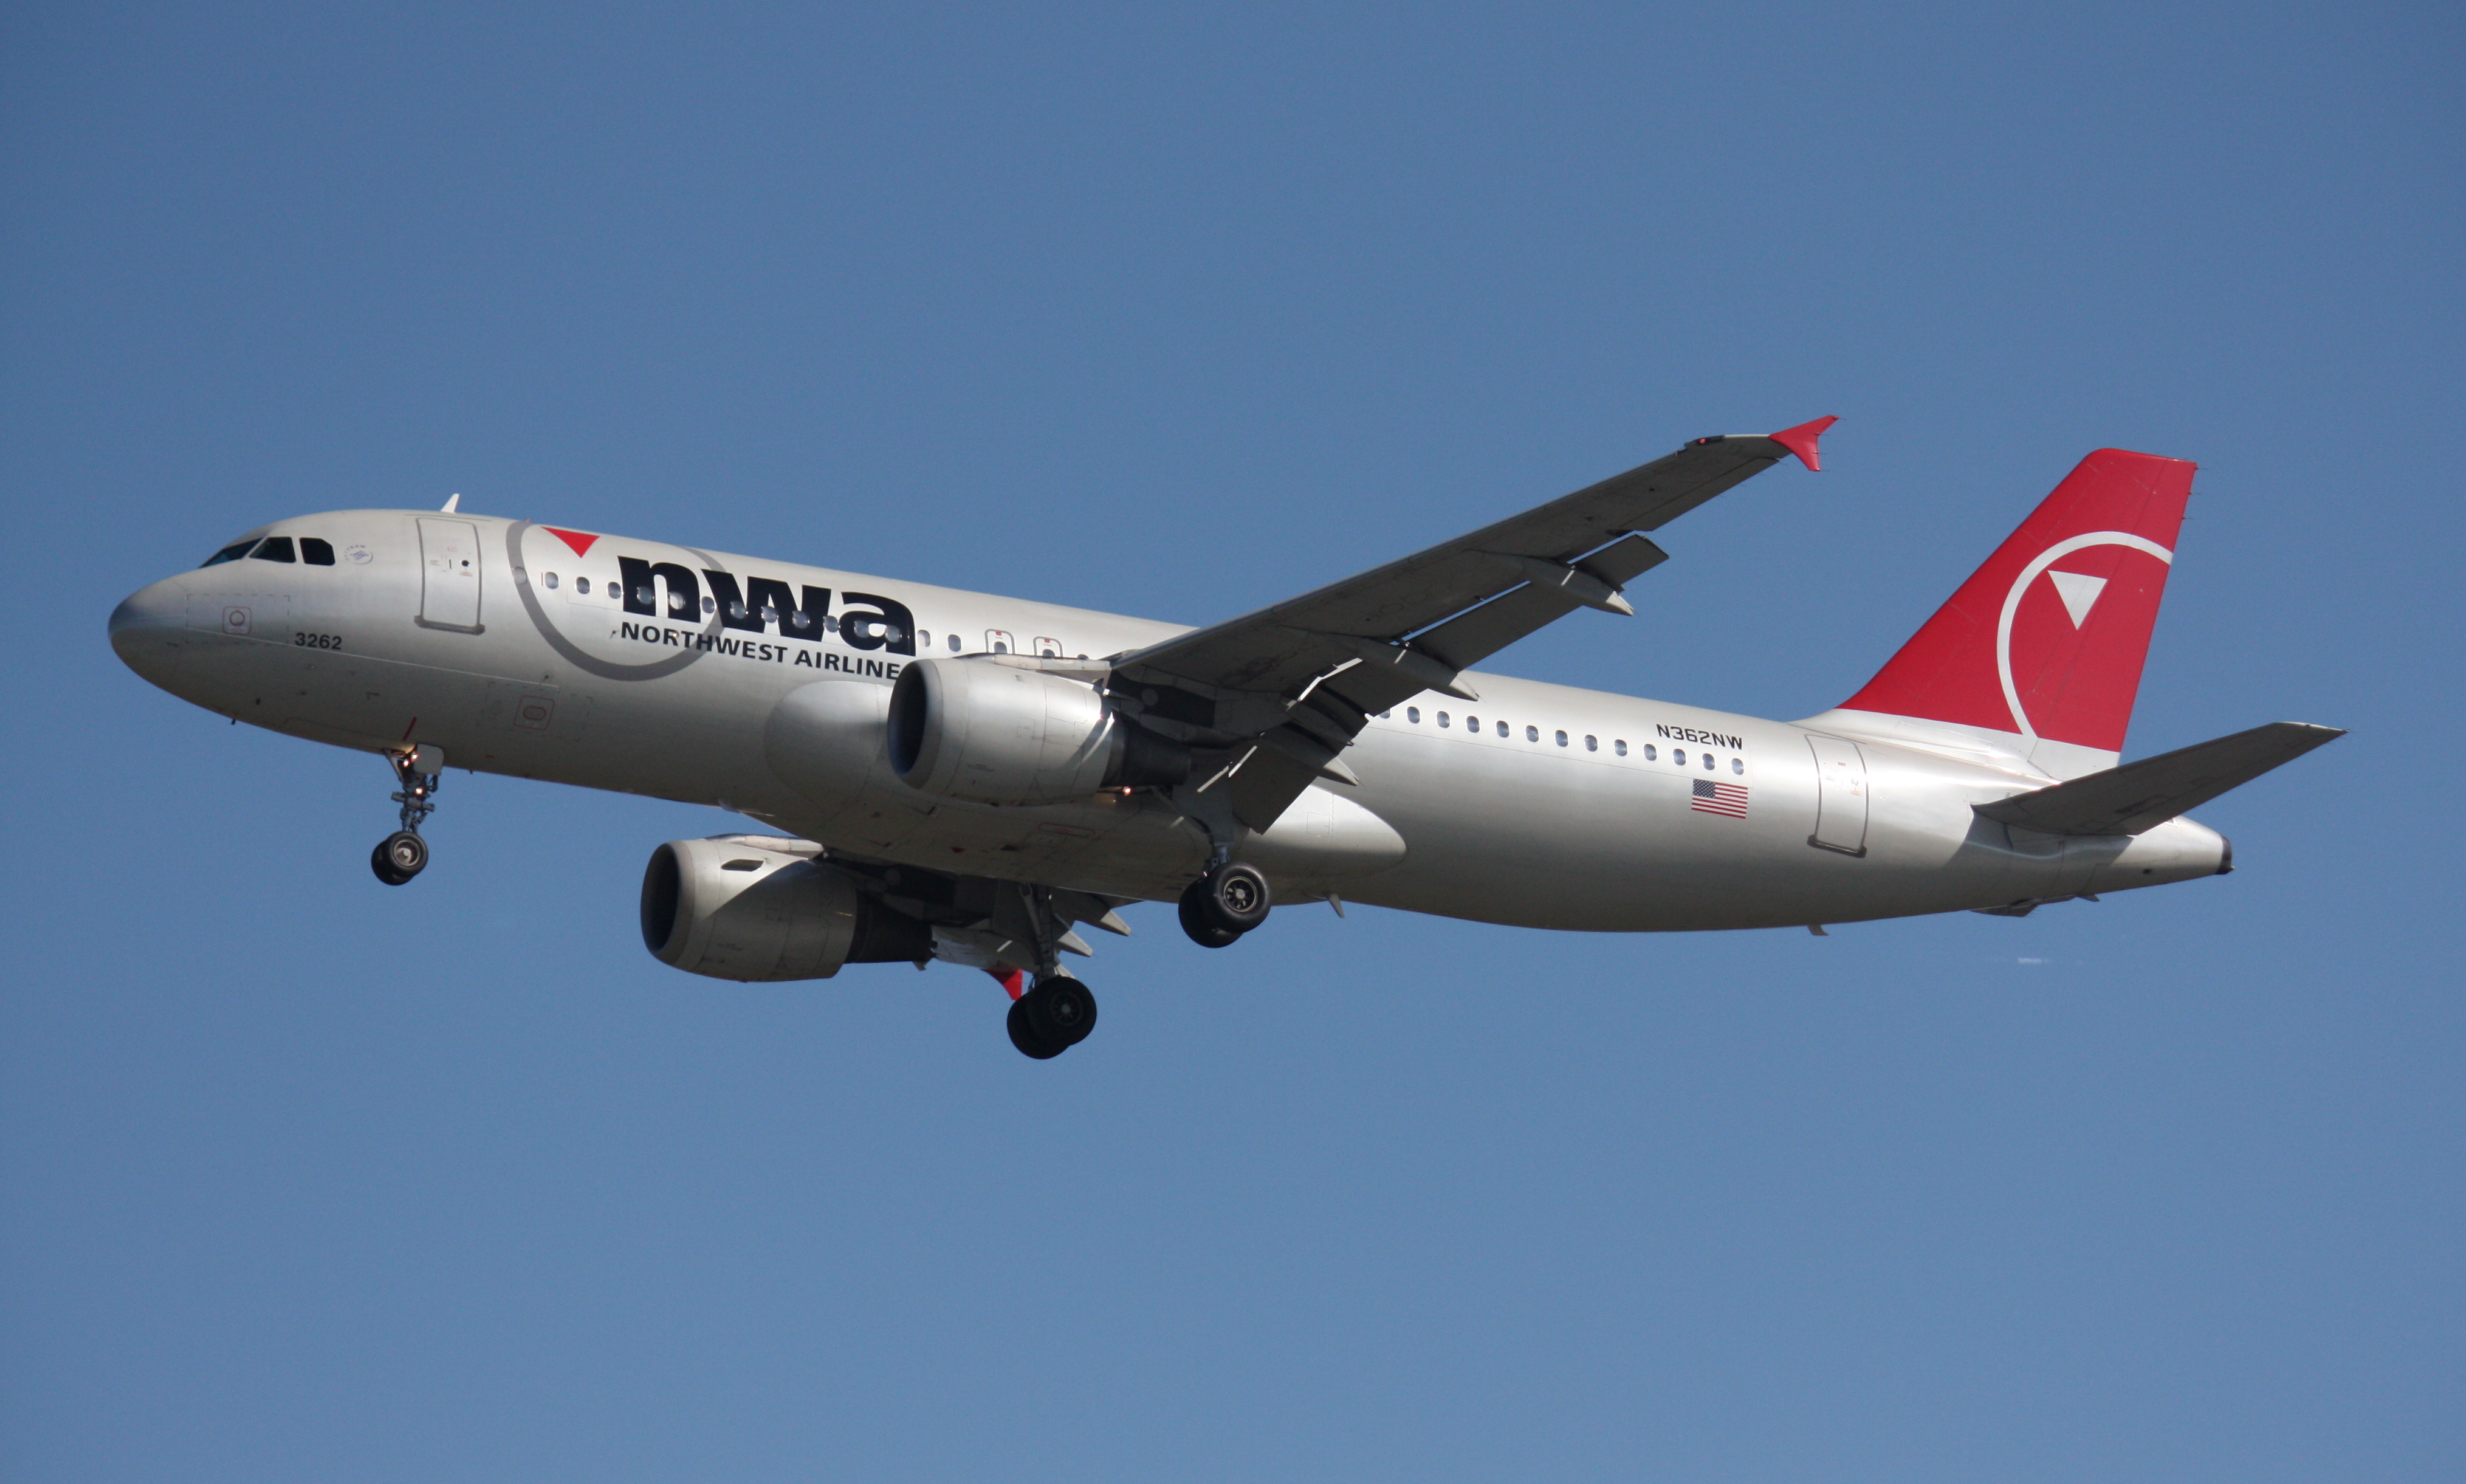
reports flights in the United States, including carriers, arrival and departure delays, and reasons
for delays, from 1987 to 2008. However, due to the large volume of data in each year, I chose just
the 2008 data.
After some preliminary wrangling, I used the Univariate, Bivariate, Multivariate exploration steps to explore my
features of interest. Then I summarized my findings to present visualizations
containing the answers to the following questions:
- How are delay times distributed? Are many flights were delayed or not?
- What is the major cause of delay?
- Were the flights over more longer distances than short distances?
- What are the top destinations and origins for the flights?
- Does distance affect delay times?
- Do some airlines experience more delays than others?
- What is the relationship between delay times and the causes of delay?
- How do the delay times and NAS delay vary with the most common destinations in each month?
Tools used: Python (pandas, numpy, matplotlib, seaborn)

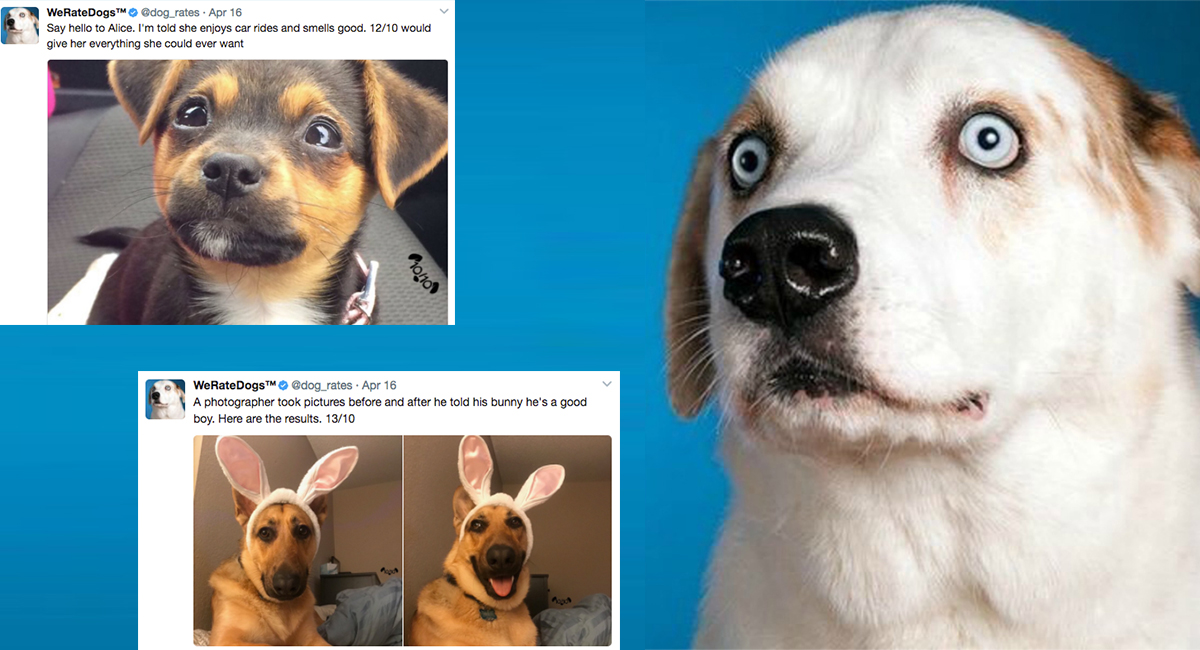
A data wrangling project carried out on the WeRateDogs Twitter account.
The data was gotten from 3 different sources, downloaded in 3 ways -
manually, programmatically and through Twitter API request.
Tools used: Python (pandas, numpy, matplotlib, seaborn, requests, tweepy)
Here, I cleaned and analyzed over 10,000 rows of movie data from 1960-2015 sourced from TMDB and pre-cleaned
by Udacity to gain insights about the average movie runtime trend, the most popular genres over the years,
the most popular production companies over the years and the factors that most likely influence the revenue
generated.
Tools used: Python(pandas, numpy, matplotlib)

My Capstone Project for the Google Data Analytics Professional Certificate. I analyzed smart
device usage data to discover trends in consumer usage and unlock growth opportunities for Bellabeat
- a wellness company catering to women.
Tools used: Microsoft Excel, Microsoft Power BI

Exploratory analysis on my LinkedIn connections data. I was able to determine the
total number of connections I have, connections I have made over time, unique
professions and the number of connections in them and the unique companies and the
number of connections in them.
Tools used: Google Sheets, Microsoft Power BI

I analyzed the Top 60 CryptoPunk NFTs by Selling Price to determine if there was a trend in the
percentage of punk types and the percentage of attribute counts.
Tools used: Microsoft Excel.
To get data about the top 60 CryptoPunk Sales, I built a web scraper.
Tools used: Python(BeautifulSoup, pandas), JSON


